Methodology
Pillars
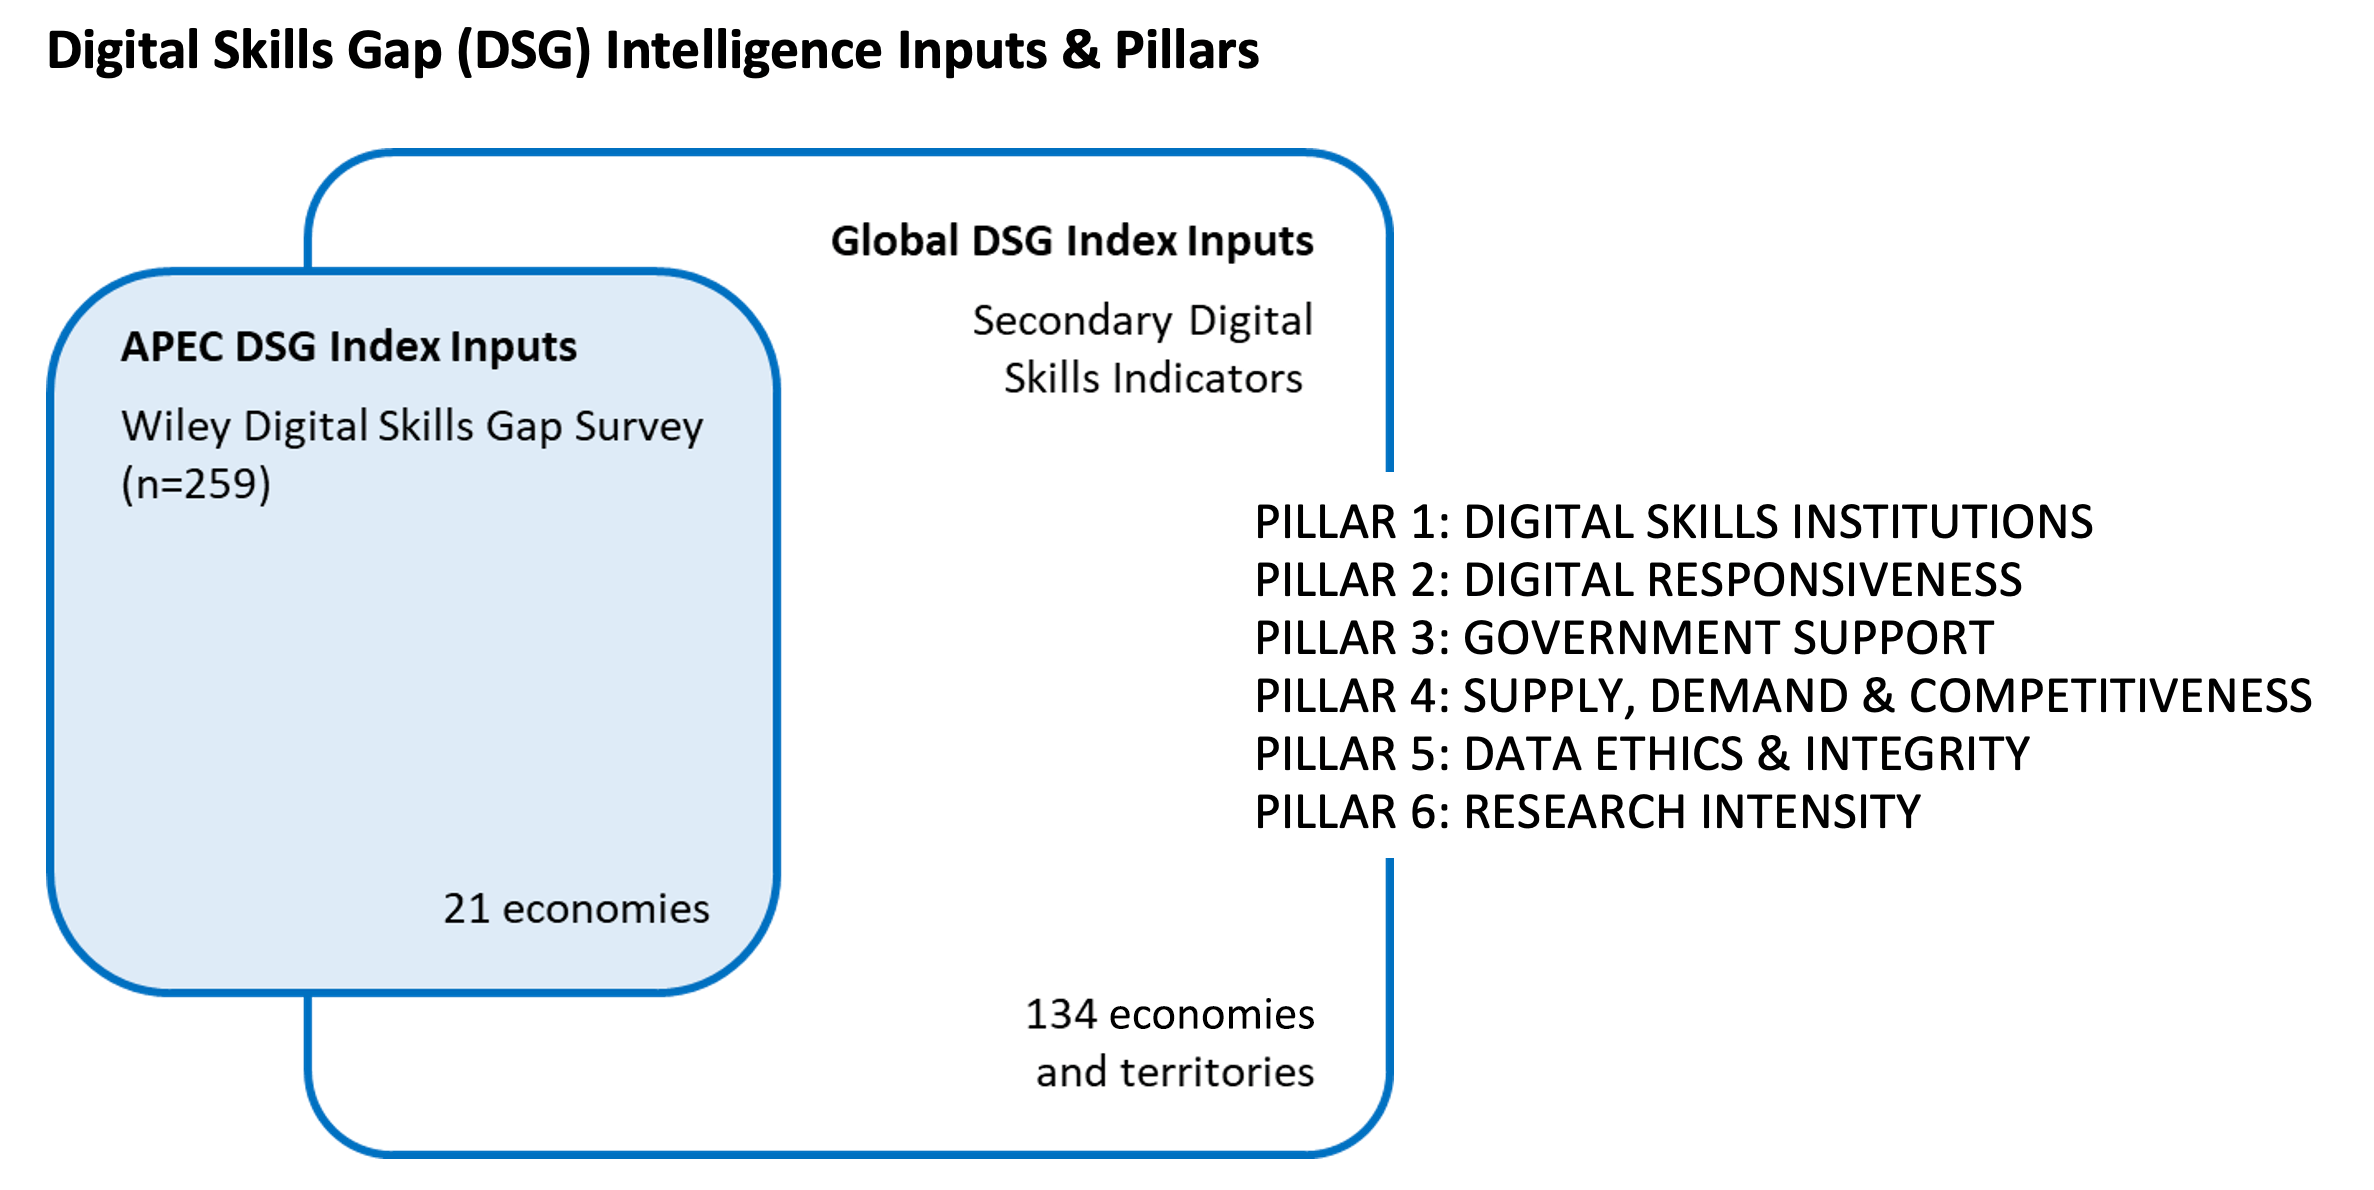
The Digital Skills Gap Index 2021 (DSGI) is built on six pillars (1) Digital Skills Institutions, (2) Digital Responsiveness, (3) Government Support, (4) Supply, Demand & Competitiveness, (5) Data Ethics & Integrity, (6) Research Intensity. Each Pillar consists of two to nine sub-pillars. With one exception (Pillar 6: Research Intensity), each pillar includes primary research inputs on the 21 APEC economies from Wiley’s Digital Skills Gap Survey, and secondary research indicators compiled from various sources to provide a genuinely global comparison.
INDEX PILLAR 1: DIGITAL SKILLS INSTITUTIONS
The Digital Skills Institutions pillar considers both core (e.g., maths literacy) and higher-level (e.g., tertiary graduates in IT subjects) digital skills, assessing institutions’ accomplishments in this regard from an output perspective. Education and training availability and competencies (e.g., availability of corporate digital staff training, the enablement of teachers and faculty in data science and analytics) further reflect an economy’s institutional strengths.
INDEX PILLAR 2: DIGITAL RESPONSIVENESS
This pillar evaluates the responsiveness of skills development and education systems to shifting digital skills demands and employers’ ever-evolving digital skills requirements. Included in the assessment are baseline quantifications of current digital and science and technology skills, as a measure of digital resilience in the face of ongoing change.
INDEX PILLAR 3: GOVERNMENT SUPPORT
Pillar 3 acknowledges the role of government in bridging the digital gap—through a deep understanding of, and commitment to, closing the digital skills gap. This support typically requires a national digital vision and entails coordination with employers and academia, and effective ICT promotion more broadly.
INDEX PILLAR 4: SUPPLY, DEMAND & COMPETITIVENESS
This, the most important pillar, collates and combines several key indicators of the digital divide (and its impact on competitiveness): the digital skills employer-job seeker mismatch, the STEM gender gap, the ease of finding/hiring staff and access to foreign talent to bridge the gap.
INDEX PILLAR 5: DATA ETHICS & INTEGRITY
Data ethics and integrity, including issues around cybersecurity, are integral to sustained and sustainable digital development.
INDEX PILLAR 6: RESEARCH INTENSITY
The Research Intensity pillar profiles academia’s focus on digital subjects, examining the level of applied digital research is evident in local contexts.
Economy/Location Coverage
The opinion survey covers the 21 APEC economies only. The secondary research indicators cover 134 economies and territories. A number of other economies and territories suffer from severe data limitations. For this reason, the following economies/locations are omitted: Bermuda, Monaco, Palestine, Democratic Republic of the Congo, Maldives, Republic of the Congo, Libya, Iraq, Côte d’Ivoire, Togo, Sudan, Niger, North Korea, Guinea-Bissau, Somalia and Netherlands Antilles, plus a number of micro-states.
Selection of Secondary Indicators
17 quantitative indicators are used to construct the Digital Skills Gap Index. They were selected based on the following criteria:
- Data Availability: Most datasets are publicly available
- Relevance: Indicators were chosen based on the opinion survey questions
- Economy/territory: Datasets cover >50% of economies
Transforming Secondary Indicators into Scores
All secondary indicators in this model are scored from “0″ to “10,” where 10 indicates the best performance (smallest digital skill gap) and 0 represents the most disadvantaged performer (biggest digital skill gap) relative to other economies/locations. The raw data were transformed to measure the digital gap based on the distance to the “best in class” using minimum/maximum normalization. For indicators where higher values indicate better performance, the following formula was applied:

Where lower values indicate better performance, the formula is inverted.
Data Normalization
This methodology is used for raw data indicators with small data variance across economies. Indicators with wide data variance are scored based on two factors: (a) Absolute Value, and (b) Value Ranking. The relative weighting of the two factors may be adjusted by the user. Value Ranking is calculated using “Percentrank,” an Excel function to provide the ranking of a value in a dataset as a percentage of the dataset (highest = 100%).
Unification of Opinion Survey on APEC Economies with Secondary Indicators in a Global Scale
Because the opinion survey was conducted within the APEC economies only, the following methodology was developed to reconcile the opinion survey results (for APEC) with secondary indicators only (for non-APEC economies and territories):
- To calculate the scores of APEC economies: opinion survey results and secondary indicators were aggregated and weighted for the 21 APEC economies.
- To calculate the scores of global economies: only secondary indicators were aggregated and weighted for all 134 economies.
- To combine APEC scores with global scores: Rescale the scores of APEC economies calculated by opinion survey results and secondary indicators (as step 1) to equal to that calculated by secondary indicators only (as step 2) by applying the following formula:

Where SI, OS refer to secondary indicators (SI) and opinion survey results (OS), respectively.
Combine the rescaled scores of APEC economies with non-APEC economies calculated from step 1 and rank the economies from the highest score to the lowest.
Treatment of Missing Data
A standardized method was used to estimate missing data points for the 134 economies included in the Index.
- Economies were assigned an Income Group and a Region as defined by the World Bank Income Groups:
Low-Income Economies ($1,025 or Less)
Lower-Middle Income Economies ($1,026 to $3,995)
Upper-Middle-Income Economies ($3,996 to $12,375)
High-Income Economies ($12,376 or more)
Regions:
East Asia and Pacific
Europe and Central Asia
Latin America and the Caribbean
Middle East and North Africa
North America
South Asia
Sub-Saharan Africa - Missing data were estimated using the average value of economies in the same income group and in the same region for each indicator.
- Where the data were missing for all the economies in a single income group and region, the average value for economies in the same income group was used. If data for this income group was not available, the lowest value of the next highest income group was used.
Download FREE
White Paper Today
Your tool to determine global digital skills levels